Enabling JMX in Hibernate, EhCache, Quartz, DBCP and Spring
Hibernate (with Spring support)
Exposing Hibernate statistics with JMX is pretty simple, however some nasty workarounds are requires when JPA API is used to obtain underlyingSessionFactoryclass JmxLocalContainerEntityManagerFactoryBean() extends LocalContainerEntityManagerFactoryBean {
override def createNativeEntityManagerFactory() = {
val managerFactory = super.createNativeEntityManagerFactory()
registerStatisticsMBean(managerFactory)
managerFactory
}
def registerStatisticsMBean(managerFactory: EntityManagerFactory) {
managerFactory match {
case impl: EntityManagerFactoryImpl =>
val mBean = new StatisticsService();
mBean.setStatisticsEnabled(true)
mBean.setSessionFactory(impl.getSessionFactory);
val name = new ObjectName("org.hibernate:type=Statistics,application=spring-pitfalls")
ManagementFactory.getPlatformMBeanServer.registerMBean(mBean, name);
case _ =>
}
}
}
Note that I have created a subclass of Springs built-in LocalContainerEntityManagerFactoryBean. By overriding createNativeEntityManagerFactory() method I can access EntityManagerFactory and by trying to downcast it to org.hibernate.ejb.EntityManagerFactoryImpl we were able to register Hibernate Mbean.One more thing has left. Obviously we have to use our custom subclass instead of
org.springframework.orm.jpa.LocalContainerEntityManagerFactoryBean. Also, in order to collect the actual statistics instead of just seeing zeroes all the way down we must set the hibernate.generate_statistics flag.@BeanHere is a sample of what can we expect to see in JvisualVM (don't forget to install all plugins!):
def entityManagerFactoryBean() = {
val entityManagerFactoryBean = new JmxLocalContainerEntityManagerFactoryBean()
entityManagerFactoryBean.setDataSource(dataSource())
entityManagerFactoryBean.setJpaVendorAdapter(jpaVendorAdapter())
entityManagerFactoryBean.setPackagesToScan("com.blogspot.nurkiewicz")
entityManagerFactoryBean.setJpaPropertyMap(
Map(
"hibernate.hbm2ddl.auto" -> "create",
"hibernate.format_sql" -> "true",
"hibernate.ejb.naming_strategy" -> classOf[ImprovedNamingStrategy].getName,
"hibernate.generate_statistics" -> true.toString
).asJava
)
entityManagerFactoryBean
}
In addition we get a nice Hibernate logging:
HQL: select generatedAlias0 from Book as generatedAlias0, time: 10ms, rows: 20
EhCache
Monitoring caches is very important, especially in application where you expect values to generally be present there. I tend to query the database as often as needed to avoid unnecessary method arguments or local caching. Everything to make code as simple as possible. However this approach only works when caching on the database layer works correctly. Similar to Hibernate, enabling JMX monitoring in EhCache is a two-step process. First you need to expose providedMBean in MBeanServer:@Bean(initMethod = "init", destroyMethod = "dispose")Note that I explicitly set
def managementService = new ManagementService(ehCacheManager(), platformMBeanServer(), true, true, true, true, true)
@Bean def platformMBeanServer() = ManagementFactory.getPlatformMBeanServer
def ehCacheManager() = ehCacheManagerFactoryBean.getObject
@Bean def ehCacheManagerFactoryBean = {
val ehCacheManagerFactoryBean = new EhCacheManagerFactoryBean
ehCacheManagerFactoryBean.setShared(true)
ehCacheManagerFactoryBean.setCacheManagerName("spring-pitfalls")
ehCacheManagerFactoryBean
}
CacheManager name. This is not required but this name is used as part of the Mbean name and a default one contains hashCode value, which is not very pleasant. The final touch is to enable statistics on a cache basis:<cache name="org.hibernate.cache.StandardQueryCache"Now we can happily monitor various caching characteristics of every cache separately:
maxElementsInMemory="10000"
eternal="false"
timeToIdleSeconds="3600"
timeToLiveSeconds="600"
overflowToDisk="false"
memoryStoreEvictionPolicy="LRU"
statistics="true"
/>

As we can see the percentage of cache misses increases. Never a good thing. If we don't enable cache statistics, enabling JMX is still a good idea since we get a lot of management operations for free, including flushing and clearing caches (useful during debugging and testing).
Quartz scheduler
In my humble opinion Quartz scheduler is very underestimated library, but I will write an article about it on its own. This time we will only learn how to monitor it via JMX. Fortunately it's as simple as adding:org.quartz.scheduler.jmx.export=trueTo
quartz.properties file. The JMX support in Quartz could have been slightly broader, but still one can query e.g. which jobs are currently running. By the way the new major version of Quartz (2.x) brings very nice DSL-like support for scheduling:val job = newJob(classOf[MyJob])
val trigger = newTrigger().
withSchedule(
repeatSecondlyForever()
).
startAt(
futureDate(30, SECOND)
)
scheduler.scheduleJob(job.build(), trigger.build())
Apache Commons DBCP
Apache Commons DBCP is the most reasonable JDBC pooling library I came across. There is also c3p0, but it doesn't seem like it's actively developed any more. Tomcat JDBC Connection Pool looked promising, but since it's bundled in Tomcat, your JDBC drivers can no longer be packaged in WAR.The only problem with DBCP is that it does not support JMX. At all (see this two and a half year old issue). Fortunately this can be easily worked around. Besides we will learn how to use Spring built-in JMX support.
Looks like the standard
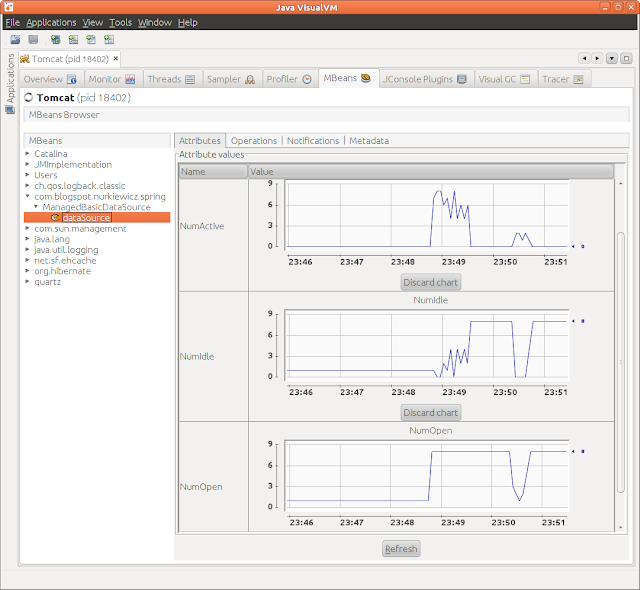
BasicDataSource has all what we need, all we have to do is to expose existing metrics via JMX. With Spring it is dead-simple – just subclass BasicDataSource and add @ManagedAttribute annotation over desired attributes:@ManagedResourceHere are few data source metrics going crazy during load-test:
class ManagedBasicDataSource extends BasicDataSource {
@ManagedAttribute override def getNumActive = super.getNumActive
@ManagedAttribute override def getNumIdle = super.getNumIdle
@ManagedAttribute def getNumOpen = getNumActive + getNumIdle
@ManagedAttribute override def getMaxActive: Int= super.getMaxActive
@ManagedAttribute override def setMaxActive(maxActive: Int) {
super.setMaxActive(maxActive)
}
@ManagedAttribute override def getMaxIdle = super.getMaxIdle
@ManagedAttribute override def setMaxIdle(maxIdle: Int) {
super.setMaxIdle(maxIdle)
}
@ManagedAttribute override def getMinIdle = super.getMinIdle
@ManagedAttribute override def setMinIdle(minIdle: Int) {
super.setMinIdle(minIdle)
}
@ManagedAttribute override def getMaxWait = super.getMaxWait
@ManagedAttribute override def setMaxWait(maxWait: Long) {
super.setMaxWait(maxWait)
}
@ManagedAttribute override def getUrl = super.getUrl
@ManagedAttribute override def getUsername = super.getUsername
}

JMX support in the Spring framework itself is pretty simple. As you have seen above exposing arbitrary attribute or operation is just a matter of adding an annotation. You only have to remember about enabling JMX support using either XML or Java (also see: SPR-8943 : Annotation equivalent to <context:mbean-export/> with @Configuration):
<context:mbean-export/>or:
@Bean def annotationMBeanExporter() = new AnnotationMBeanExporter()This article wasn't particularly exciting. However, the knowledge of JMX metrics will enable us to write simple yet fancy dashboards in no time. Stay tuned! Tags: ehcache, hibernate, jmx, quartz, spring
