@Cacheable overhead in Spring
@Cacheable("books")
public Book findBook(ISBN isbn) {...}
"books" is a cache name, isbn parameter becomes cache key and returned Book object will be placed under that key. The meaning of cache name is dependant on the underlying cache manager (EhCache, concurrent map, etc.) - Spring makes it easy to plug different caching providers. But this post won't be about caching feature in Spring...Some time ago my teammate was optimizing quite low-level code and discovered an opportunity for caching. He quickly applied
@Cacheable just to discover that the code performed worse then it used to. He got rid of the annotation and implemented caching himself manually, using good old java.util.ConcurrentHashMap. The performance was much better. He blamed @Cacheable and Spring AOP overhead and complexity. I couldn't believe that a caching layer can perform so poorly until I had to debug Spring caching aspects few times myself (some nasty bug in my code, you know, cache invalidation is one of the two hardest things in CS). Well, the caching abstraction code is much more complex than one would expect (after all it's just get and put!), but it doesn't necessarily mean it must be that slow?In science we don't believe and trust, we measure and benchmark. So I wrote a benchmark to precisely measure the overhead of
@Cacheable layer. Caching abstraction layer in Spring is implemented on top of Spring AOP, which can further be implemented on top of Java proxies, CGLIB generated subclasses or AspectJ instrumentation. Thus I'll test the following configurations:- no caching at all - to measure how fast the code is with no intermediate layer
- manual cache handling using
ConcurrentHashMapin business code
@Cacheablewith CGLIB implementing AOP
@Cacheablewithjava.lang.reflect.Proxyimplementing AOP
@Cacheablewith AspectJ compile time weaving (as similar benchmark shows, CTW is slightly faster than LTW)
- Home-grown AspectJ caching aspect - something between manual caching in business code and Spring abstraction
ConcurrentMapCacheManager from Spring. So here is a method in question:public interface Calculator {
int identity(int x);
}
public class PlainCalculator implements Calculator {
@Cacheable("identity")
@Override
public int identity(int x) {
return x;
}
}
I know, I know there is no point in caching such a method. But I want to measure the overhead of caching layer (during cache hit to be specific). Each caching configuration will have its own ApplicationContext as you can't mix different proxying modes in one context:public abstract class BaseConfig {
@Bean
public Calculator calculator() {
return new PlainCalculator();
}
}
@Configuration
class NoCachingConfig extends BaseConfig {}
@Configuration
class ManualCachingConfig extends BaseConfig {
@Bean
@Override
public Calculator calculator() {
return new CachingCalculatorDecorator(super.calculator());
}
}
@Configuration
abstract class CacheManagerConfig extends BaseConfig {
@Bean
public CacheManager cacheManager() {
return new ConcurrentMapCacheManager();
}
}
@Configuration
@EnableCaching(proxyTargetClass = true)
class CacheableCglibConfig extends CacheManagerConfig {}
@Configuration
@EnableCaching(proxyTargetClass = false)
class CacheableJdkProxyConfig extends CacheManagerConfig {}
@Configuration
@EnableCaching(mode = AdviceMode.ASPECTJ)
class CacheableAspectJWeaving extends CacheManagerConfig {
@Bean
@Override
public Calculator calculator() {
return new SpringInstrumentedCalculator();
}
}
@Configuration
@EnableCaching(mode = AdviceMode.ASPECTJ)
class AspectJCustomAspect extends CacheManagerConfig {
@Bean
@Override
public Calculator calculator() {
return new ManuallyInstrumentedCalculator();
}
}
Each @Configuration class represents one application context. CachingCalculatorDecorator is a decorator around real calculator that does the caching (welcome to the 1990s):public class CachingCalculatorDecorator implements Calculator {
private final Map<Integer, Integer> cache = new java.util.concurrent.ConcurrentHashMap<Integer, Integer>();
private final Calculator target;
public CachingCalculatorDecorator(Calculator target) {
this.target = target;
}
@Override
public int identity(int x) {
final Integer existing = cache.get(x);
if (existing != null) {
return existing;
}
final int newValue = target.identity(x);
cache.put(x, newValue);
return newValue;
}
}
SpringInstrumentedCalculator and ManuallyInstrumentedCalculator are exactly the same as PlainCalculator but they are instrumented by AspectJ compile-time weaver with Spring and custom aspect accordingly. My custom caching aspect looks like this:public aspect ManualCachingAspect {
private final Map<Integer, Integer> cache = new ConcurrentHashMap<Integer, Integer>();
pointcut cacheMethodExecution(int x): execution(int com.blogspot.nurkiewicz.cacheable.calculator.ManuallyInstrumentedCalculator.identity(int)) && args(x);
Object around(int x): cacheMethodExecution(x) {
final Integer existing = cache.get(x);
if (existing != null) {
return existing;
}
final Object newValue = proceed(x);
cache.put(x, (Integer)newValue);
return newValue;
}
}
After all this preparation we can finally write the benchmark itself. At the beginning I start all the application contexts and fetch Calculator instances. Each instance is different. For example noCaching is a PlainCalculator instance with no wrappers, cacheableCglib is a CGLIB generated subclass while aspectJCustom is an instance of ManuallyInstrumentedCalculator with my custom aspect woven.private final Calculator noCaching = fromSpringContext(NoCachingConfig.class);I'm going to exercise each
private final Calculator manualCaching = fromSpringContext(ManualCachingConfig.class);
private final Calculator cacheableCglib = fromSpringContext(CacheableCglibConfig.class);
private final Calculator cacheableJdkProxy = fromSpringContext(CacheableJdkProxyConfig.class);
private final Calculator cacheableAspectJ = fromSpringContext(CacheableAspectJWeaving.class);
private final Calculator aspectJCustom = fromSpringContext(AspectJCustomAspect.class);
private static <T extends BaseConfig> Calculator fromSpringContext(Class<T> config) {
return new AnnotationConfigApplicationContext(config).getBean(Calculator.class);
}
Calculator instance with the following test. The additional accumulator is necessary, otherwise JVM might optimize away the whole loop (!):private int benchmarkWith(Calculator calculator, int reps) {
int accum = 0;
for (int i = 0; i < reps; ++i) {
accum += calculator.identity(i % 16);
}
return accum;
}
Here is the full caliper test without parts already discussed:public class CacheableBenchmark extends SimpleBenchmark {
//...
public int timeNoCaching(int reps) {
return benchmarkWith(noCaching, reps);
}
public int timeManualCaching(int reps) {
return benchmarkWith(manualCaching, reps);
}
public int timeCacheableWithCglib(int reps) {
return benchmarkWith(cacheableCglib, reps);
}
public int timeCacheableWithJdkProxy(int reps) {
return benchmarkWith(cacheableJdkProxy, reps);
}
public int timeCacheableWithAspectJWeaving(int reps) {
return benchmarkWith(cacheableAspectJ, reps);
}
public int timeAspectJCustom(int reps) {
return benchmarkWith(aspectJCustom, reps);
}
}
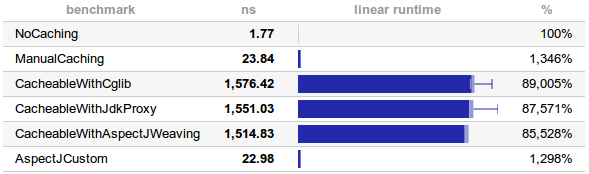
I hope you are still following our experiment. We are now going to execute Calculate.identity() millions of times and see which caching configuration performs best. Since we only call identity() with 16 different arguments, we hardly ever touch the method itself as we always get cache hit. Curious to see the results?benchmark ns linear runtime
NoCaching 1.77 =
ManualCaching 23.84 =
CacheableWithCglib 1576.42 ==============================
CacheableWithJdkProxy 1551.03 =============================
CacheableWithAspectJWeaving 1514.83 ============================
AspectJCustom 22.98 =
Interpretation
Let's go step by step. First of all calling a method in Java is pretty darn fast! 1.77 nanoseconds, we are talking here about 3 CPU cycles on my Intel(R) Core(TM)2 Duo CPU T7300 @ 2.00GHz! If this doesn't convince you that Java is fast, I don't know what will. But back to our test.Hand-made caching decorator is also pretty fast. Of course it's slower by an order of magnitude compared to pure function call, but still blazingly fast compared to all
@Scheduled benchmarks. We see a drop by 3 orders of magnitude, from 1.8 ns to 1.5 μs. I'm especially disappointed by the @Cacheable backed by AspectJ. After all caching aspect is precompiled directly into my Java .class file, I would expect it to be much faster compared to dynamic proxies and CGLIB. But that doesn't seem to be the case. All three Spring AOP techniques are similar.The greatest surprise is my custom AspectJ aspect. It's even faster than
CachingCalculatorDecorator! maybe it's due to polymorphic call in the decorator? I strongly encourage you to clone this benchmark on GitHub and run it (mvn clean test, takes around 2 minutes) to compare your results.Conclusions
You might be wondering why Spring abstraction layer is so slow? Well, first of all, check out the core implementation inCacheAspectSupport - it's actually quite complex. Secondly, is it really that slow? Do the math - you typically use Spring in business applications where database, network and external APIs are the bottleneck. What latencies do you typically see? Milliseconds? Tens or hundreds of milliseconds? Now add an overhead of 2 μs (worst case scenario). For caching database queries or REST calls this is completely negligible. It doesn't matter which technique you choose.But if you are caching very low-level methods close to the metal, like CPU-intensive, in-memory computations, Spring abstraction layer might be an overkill. The bottom line: measure!
PS: both benchmark and contents of this article in Markdown format are freely available.
Tags: aop, aspectj, caliper, cglib, performance, spring